LAW OF DEMAND AND DEMAND CURVE EXPLAINED
Introduction:
The law of demand is a fundamental principle in economics that governs the relationship between the price of a good or service and the quantity demanded by consumers. This inverse relationship, known as the law of demand, forms the basis for understanding consumer behavior and market dynamics. The demand curve, a graphical representation of this relationship, provides valuable insights into how changes in price impact the quantity demanded. In this article, we will delve into the intricacies of the law of demand, explore the factors that influence the demand curve, and provide real-world examples for a comprehensive understanding.
The Law of Demand:
Definition and Explanation:
The law of demand states that, all other factors being constant (ceteris paribus), the quantity demanded of a good or service is inversely related to its price. In simpler terms, as the price of a product increases, consumers tend to demand less of it, and as the price decreases, consumers are willing to demand more. This inverse relationship is rooted in the concept of diminishing marginal utility, which suggests that the additional satisfaction or utility derived from consuming each additional unit of a good decreases.
Factors Influencing Demand:
While price is the primary factor influencing demand, several other variables also play a significant role. These include income levels, consumer preferences, the prices of related goods (substitutes and complements), expectations, and demographic factors. Understanding these factors is crucial for predicting how changes in the market can impact the demand for a product.
Income Levels:
Income levels can affect both the ability and willingness of consumers to purchase a good. Generally, an increase in income leads to a higher demand for normal goods, as consumers can afford to buy more. Conversely, a decrease in income may shift consumers toward cheaper alternatives or result in lower demand for certain goods.
Consumer Preferences:
Consumer preferences can significantly influence demand. Changes in tastes and trends can lead to shifts in the demand for specific products. For example, a growing preference for environmentally friendly products may increase the demand for electric vehicles.
Prices of Related Goods:
The prices of related goods, including substitutes and complements, can also impact demand. Substitutes are goods that can be used in place of each other, like tea and coffee. When the price of one substitute increases, the demand for the other may rise. Complements, on the other hand, are goods that are used together, such as smartphones and mobile data plans. A decrease in the price of one complement can increase the demand for the other.
Expectations:
Consumer expectations about future prices, income levels, or product availability can influence their current purchasing decisions. For instance, if consumers anticipate a price increase for a particular good in the future, they may demand more of it in the present.
Demographic Factors:
Demographic characteristics such as age, gender, and geographic location can also impact demand. Certain products may be more in demand among specific age groups or regions, influencing the overall demand for those goods.
The Demand Curve:
Definition and Explanation:
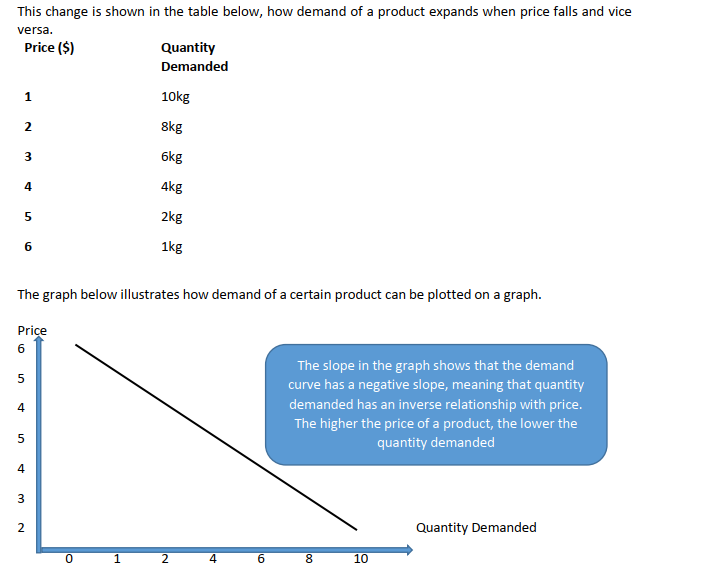
The demand curve is a graphical representation of the relationship between the price of a good or service and the quantity demanded. It is typically depicted as a downward-sloping line, with price on the vertical axis and quantity demanded on the horizontal axis. This curve illustrates the law of demand by showing that as price decreases, the quantity demanded increases, and vice versa.
Shape of the Demand Curve:
The shape of the demand curve can vary depending on the elasticity of demand, which measures the responsiveness of quantity demanded to changes in price. There are three main types of demand curves based on elasticity:
Elastic demand: When the demand curve is relatively flat, indicating that a small change in price leads to a significant change in quantity demanded. This is often seen in products with many substitutes.
Inelastic demand: When the demand curve is steep, suggesting that a large change in price has a relatively small impact on quantity demanded. Essential goods with few substitutes typically exhibit inelastic demand.
Unit elastic demand: When the percentage change in quantity demanded is equal to the percentage change in price, resulting in a linear demand curve.
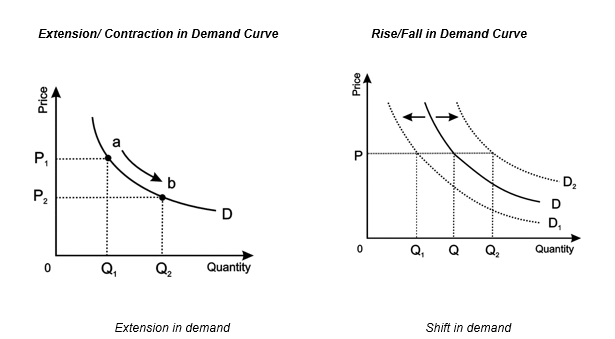
Factors Shifting the Demand Curve:
Changes in factors other than price, such as income levels, consumer preferences, or expectations, can lead to shifts in the demand curve. These shifts represent changes in the overall demand for a product at each price level, causing the entire curve to move either to the right (increase in demand) or to the left (decrease in demand).
Real-World Examples:
Price Change:
Consider the market for smartphones. When the price of smartphones increases, consumers may opt for cheaper alternatives or delay their purchase, resulting in a decrease in the quantity demanded. Conversely, a price decrease may stimulate demand as consumers find the product more affordable.
Income Change:
Imagine a scenario where there is a rise in disposable income levels. In the market for luxury items, such as designer clothing or fine dining experiences, this increase in income can lead to a rightward shift in the demand curve. Consumers, with higher incomes, are now willing and able to purchase these luxury items, increasing the overall demand at each price level.
Change in Consumer Preferences:
Shifts in consumer preferences can also impact the demand curve. For instance, if environmental consciousness increases, the demand for eco-friendly products may surge, causing a rightward shift in the demand curve for hybrid or electric vehicles.
Substitutes and Complements:
Let’s consider coffee and tea as examples of substitute goods. When the price of coffee increases, consumers may switch to tea as a substitute, leading to an increase in the demand for tea and a leftward shift in its demand curve. On the other hand, if the price of coffee decreases, consumers may opt for coffee instead of tea, causing a rightward shift in the demand curve for coffee.
Conclusion:
The law of demand and the demand curve are fundamental concepts in economics that provide insights into consumer behavior and market dynamics. The law of demand highlights the inverse relationship between price and quantity demanded, while the demand curve visually represents this relationship. Understanding the factors that influence demand and the shape of the demand curve is crucial for businesses, policymakers, and economists to make informed decisions. Real-world examples help illustrate how changes in price, income, consumer preferences, and related goods can impact the demand for products, shaping market trends and influencing economic outcomes.
SUMMARY:
DEMAND
Demand in power to purchase a product with willingness to purchase it. Willingness and ability to pay are necessary conditions of demand.
Law of demand
Law of demand states that when price of a product increases, its demand decreases in market and vice versa.
Assumptions of Law
- no change in taste or fashion.
- Money income of the consumer remains constant
- Price of other goods remains constant.
Demand schedule and curve:
The demand schedule refers to the various quantities of a good which a consumer would demand at various hypothetical prices.
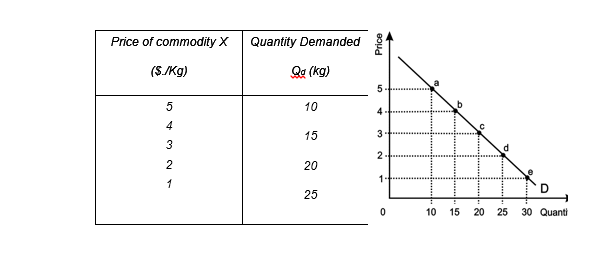
Negatively sloped demand curve also shows that there is a negative relation between price and quantity demanded of a good.
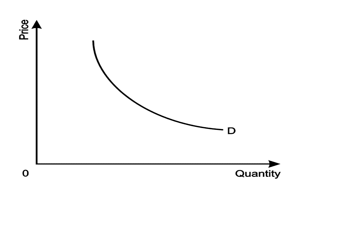
Real demand curve:
A real demand curve slopes downward from left to right and convex to the origin, which shows that quantity demanded increases progressively with the fall in price.
Reasons of negative slope of demand curve:
- Income effect;
- Substitution effect;
- Entry of new consumers into the market;
- Diminishing Marginal Utility.
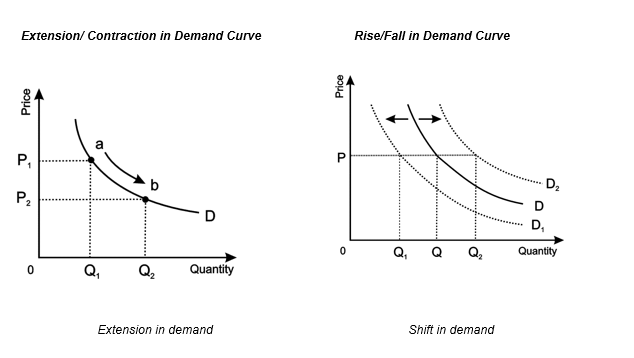
The first factor causes on-the-line change while the remaining factors cause Shift in demand curve. The price of a good held constant, when the demand increases it shifts demand curve upwards while the decrease in demand is shown as inward shift in demand curve.