Breakeven is the point at which at profit is “ZERO”. It’s important for entity to know how much revenue to revue it has to earn to reach at point after passing which they are going to start earning profits. It helps entity in making important decisions adding to its profits. It makes life much easier for you if you that by selling certain number of units you can cover total costs and from now you can strive for profits, breakeven ratios are there to rescue in this area.
Break Even Point
Total Revenue – Total Cost = 0
Break Even Point(In $)
Fixed Cost / CS Ratio OR
Break Even Point * Selling Price
Break Even Point(Quantity)
Fixed Cost / Contribution per unit
Target profit
Target profit shows units entity must have to sold in order to earn certain profit called target profit. It helps entity to anticipate future targets keeping in mind breakeven
UNITS
Total Required Contribution (Fixed cost + Target profit) / Contribution per unit (Sale per unit – Variable cost per unit)
VALUES
Total Required Contribution (Fixed cost + Target profit) / C/M Ratio (Contribution Margin Ratio)
Contribution to sale ratio
Contribution= sale revenue less variable cost
FORMULA =Sales – variable cost
C/S ratio= Contribution per unit/ selling price per unit
OR
Total contribution/ total sale revenue
Margin of safety
Margin of safety guides entity regarding safety margin it has before getting losses. It is basically the difference between units sold and units at breakeven point, the resulting GAP shows the safety margin
Margin of Safety = Total Sales – Break even Sales
Margin of Safety ($) = Profit / CS Ratio
Margin of Safety (units) = Profit / Contribution per unit
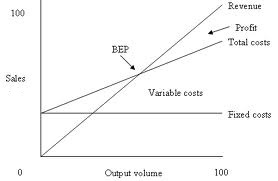
Breakeven Charts
Breakeven shows in graphical way the same picture as above formula. Graphical representation makes understanding of issues much easier.it helps to identify :
- Total cost
- Fixe cost
- Breakeven point
- Margin of safety
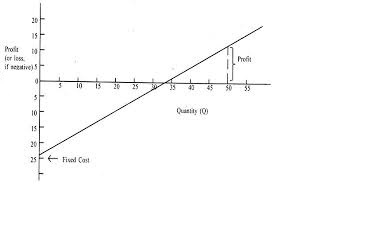
profit volume chart